Maryland’s Retail Electricity Predatory Pricing in 10 Photos
Sadly, it’s not news that Maryland families have paid $1 billion more for switching to retail energy suppliers from their regulated utility’s electricity and gas since 2014. Turns out Maryland’s retail energy overpayments aren’t unique. The Wall Street Journal reported that across all 13 “competitive” energy states and DC, residential accounts have spent at least $30 billion more since 2010.
What is new is that a Berkeley Energy Institute at Haas report explains the factors driving retail energy’s high prices. Relying on BGE billing data, customer surveys and sophisticated economic modeling, PhD student Jenya Kahn-Lang’s 108-page dissertation, Competing for (In)attention: Price Discrimination in Residential Electricity Markets, details why wealthier households save and why low-income Hispanic, black and immigrant families get ripped off.
"I was initially interested in this topic because I wanted to better understand the impacts of retail electricity restructuring relative to traditional utility regulation and municipal electricity provision. Once I started looking into prices in restructured residential markets, I had many questions about the drivers of the extreme price variation I found and its implications for social equity.” explained Ms. Kahn-Lang.
Electricity competition was supposed to make home energy cheaper. Yet profits undergird Maryland’s dysfunctional retail energy market. The state set-up an optimal environment for industry to financially prey on low-income communities of color. The 1999 deregulatory energy law eliminated retail energy pricing oversight – retail energy rates have no limits. Then, in 2010, regulators set-up a unique risk-free revenue system through utility “purchase of receivables.”[1] Not only are energy supplier charges included on the regulated BGE and Pepco bills, but the utilities collect the suppliers’ charges. Even if suppliers’ customers default because of high “competitive” energy prices, suppliers still get paid.
This economic report is a lot to unpack. Below are 10 key charts that explain how this retail energy market went sideways and where to find the charts in the report. The article’s insights and statements are mine, not the report author’s. The report author’s findings and conclusions are written word-for-word “from the report.”
This article’s goal is to bring sunlight to this dissertation. Policymakers, state legilstors, the media and advocates should dive into this research and take action. Ample data exists that competitive residential energy is financially harmful. Given today’s volatile gas markets creating future rate uncertainty coupled with retail energy’s predatory pricing falling on vulnerable families, retail choice reform is essential and responsible.
The report’s main finding is clear. From the report: “In contrast, I study firms’ decisions to actively market to consumers since direct marketing is responsible for most switching. I find evidence of structural discrimination: profit-driven marketing strategies interact with pre-existing residential segregation to disproportionately harm marginalized communities. [2] “I find that these pricing patterns hold more broadly across other states, time, data sources, and metrics of marginalized communities.” [3]
[1] Page 8. [2] Page 5. [3] Page 2
Maryland’s Competitive Electricity Predatory Pricing in 10 Photos
#1 Maryland Families Paid $640 million MORE for electricity
Maryland has no official retail energy rate reporting. Federal reporting reveals:
- Rates keep going up as customer counts keep going down.
- Each account overpaid $290 on average in 2021, up from $161 in 2014.
- Highest overpayments during the pandemic.

#2. In Maryland, 310,000 families paid nearly 50% more for electricity
From report, “I observe substantial pricing variation within firms as well as across firms.“ [4]
Maryland’s residential electricity market size is 2.3 million accounts. Sliced into 3 segments:
#1 REGULATED: 1.9 million customers buy regulated utility electricity supply. Average rate: 7.2¢ per kilowatt hour.
#2 RETAIL - CONSTELLATION: 94,000 “large electricity households” chose Constellation Energy, the state’s top supplier. Average rate: 7.5 ¢ per kilowatt. Accounts use 50% more electricity each year. Higher income accounts?
#3 “ALL OTHER” RETAIL BRANDS: 310,000 retail accounts paid the remaining 42 retail electric brands on average 10.7 ¢ per kilowatt hour. That’s 48% more, or $366 more each household. Low-income accounts?
From report, “I show that consumers pay different prices for electricity in the same market, with low-income households and marginalized communities paying systematically higher electricity prices than their higher-income counterparts.”[5]

#3 About 25% BGE residential market chose retail energy. Sizeable Low-Income Segment.
From report: “The primary data set used in this paper is Baltimore Gas and Electric Company (BGE) billing data for December 2018 through March 2022. The data set includes billing information for all residential BGE accounts that participated in retail choice during this timeframe. “[6]
[6] Page 8

#4 Door-to-Door is Retailer’s Primary Sales Acquisition Channel
Retail energy’s primary sales channel is direct consumer sales, labeled “marketing” in this report chart. Retail suppliers enroll customer through door-to-door marketing, sales agents embedded in retail outlets (Walmart’s, BWI Airport, farmers’ markets), direct mail or telemarketing.[7] The report defines “Marketing” as direct sales, and chart below labels “Search” to quantify online enrollments through the Maryland Electric Choice website. Active shoppers are a minority of sales.
From report, “These results suggest that firms can price discriminate on sign-up method. Consumers who sign up through methods other than online tend to receive higher prices.” [8]
From Report: Figure 9: Estimated Daily Sign Ups by Type and Date pg. 2

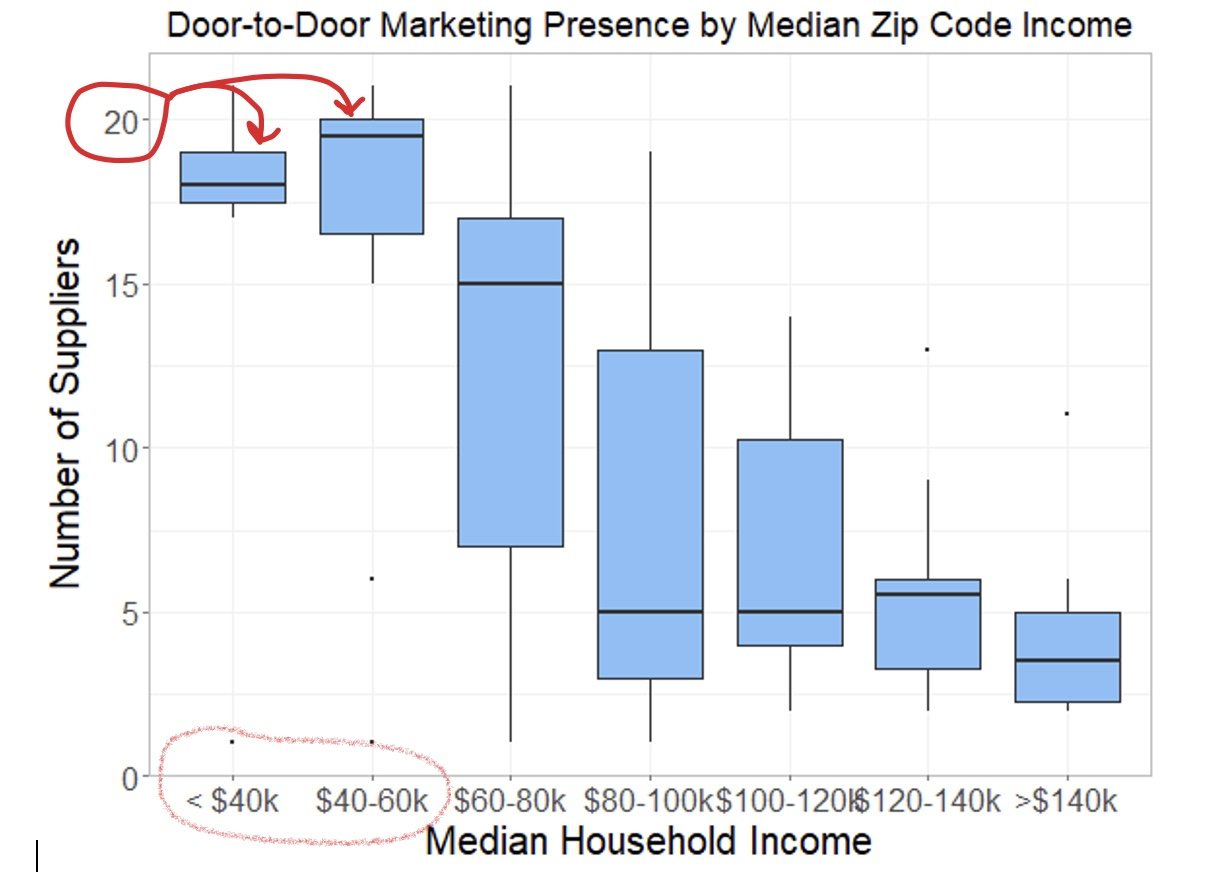
#5 Door-to-Door Sales Agents Sell in Low-Income ZIP Codes
In 2020, Maryland’s Public Service Commission (PSC) reported the number of retail energy supplier companies that sold door-to-door and in which ZIP codes they knocked on doors. The PSC data showed that most suppliers targeted Baltimore City, yet demographic data was unknown.
From report, “Suppliers disproportionately market in low-income areas.” [9]
“The survey confirms that there is more direct marketing in low-income areas. About 77% of respondents in low-income areas reported being approached by an in-person marketer within the past two years. Marketing is significantly lower in high-income areas, where only 57% met an in-person marketer (χ2 = 33).” [10]
“Low-income households are also more likely to be approached by a telemarketer. (χ2 = 18).”[11]
#7 Lowest income ZIP codes Pay Highest Contract STARTING rates
While wealthy neighborhoods, like 21210’s Roland Park, contract “starting” rates were just below BGE’s 7.2 ¢ price-to-compare, contract starting rates in Baltimore’s low-income neighborhoods are much higher.
From report, “Low-income households pay substantially higher prices than high-income households primarily due to lower [door-to-door] marketing costs in low-income communities.” [12]
“I also show that [door-to-door] marketing causes low-income and marginalized communities to pay relatively high prices.” [13]
From report: Figure A5: Sign-up Price Map of Baltimore City: September 2019 pg. 57
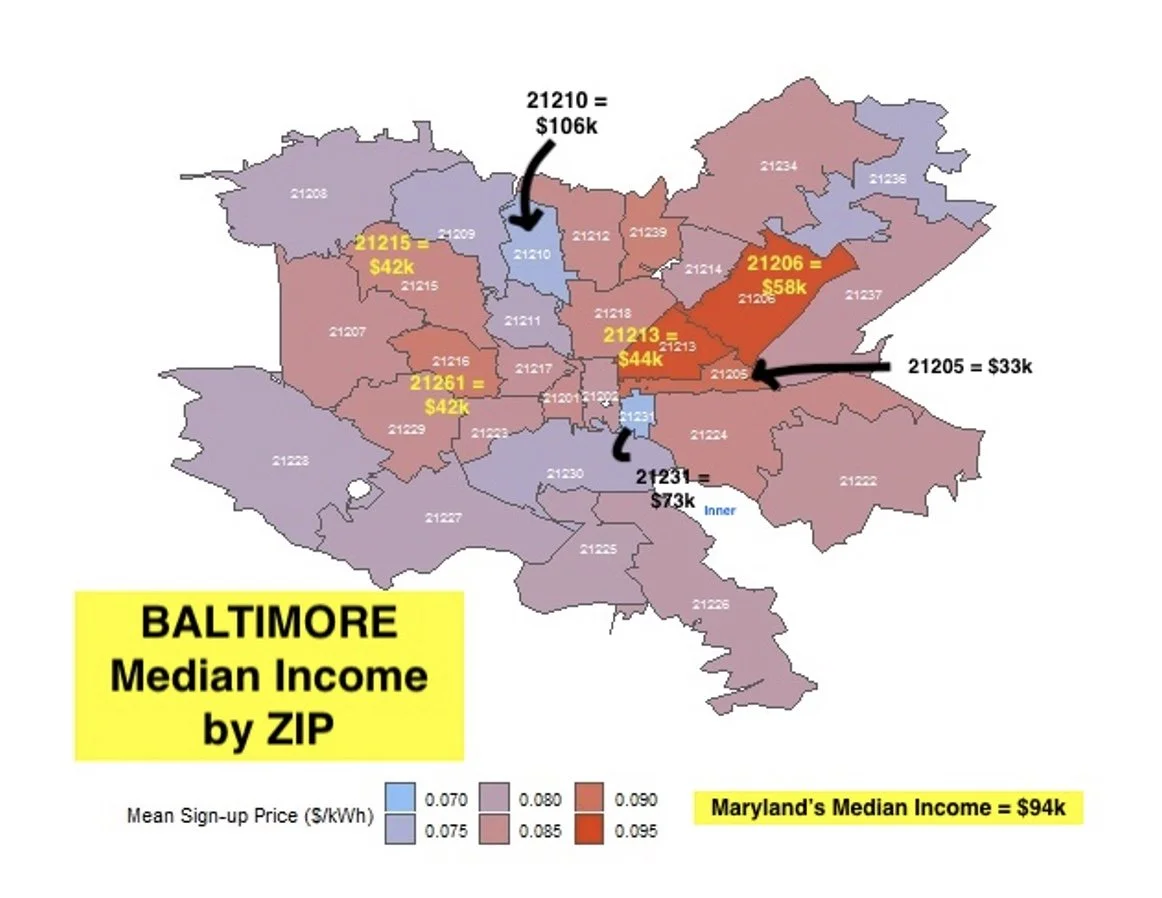
I added median income figures to help readers understand Baltimore’s ZIP codes median incomes. Highest starting rates in Maryland’s lowest income ZIP codes.
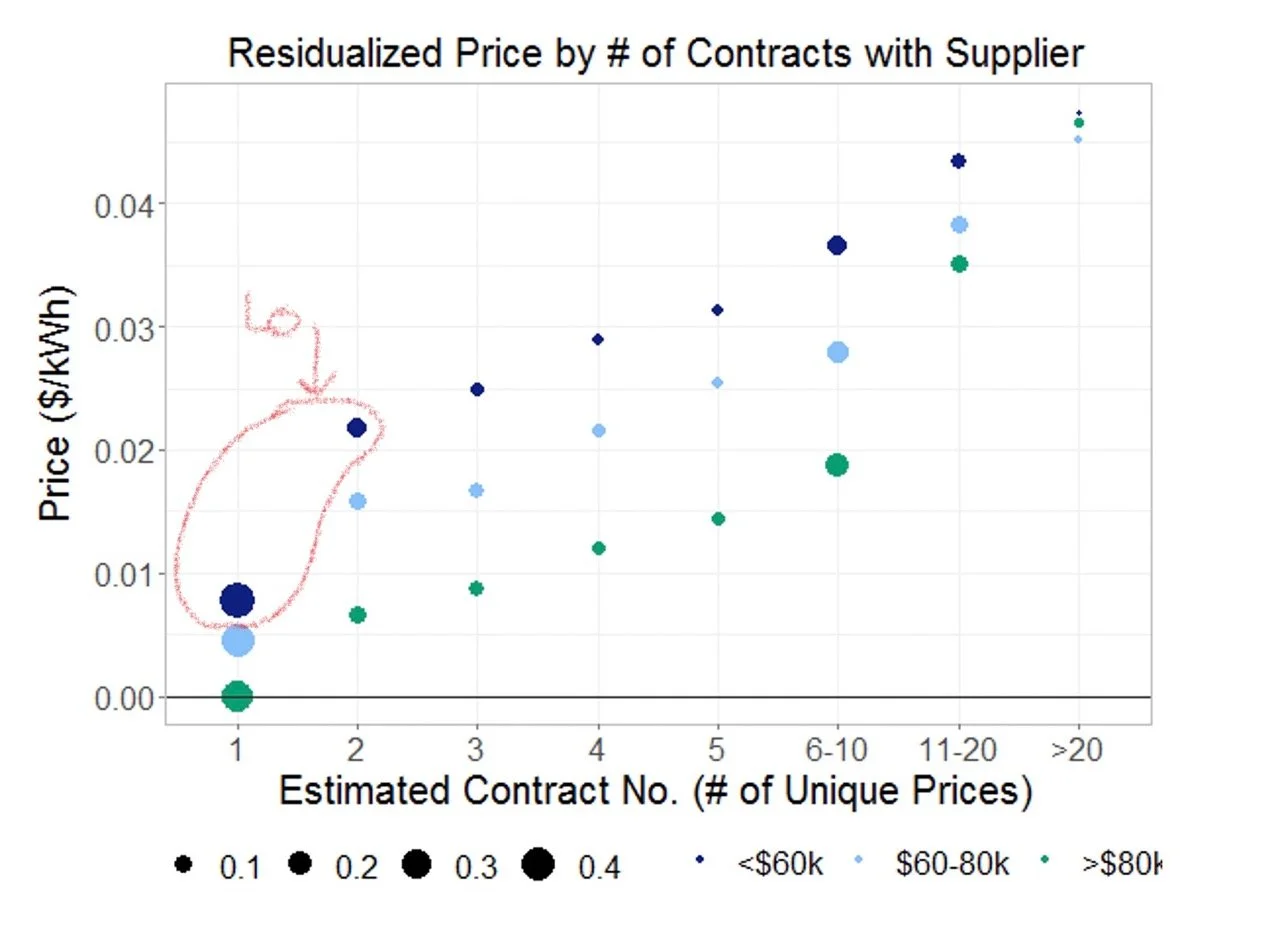
#8 Deliberate pricing discrimination - Low-Income ZIP codes Paid Highest RENEWAL rates
The report examined supplier renewal rates by income levels by analyzing all BGE retail contracts as if they all started on the same “day 1.” While suppliers claim to offer fixed rates selling “peace of mind” and “price stability,” the report found the average fixed price contract lasted only 2 months before the rates jump to variable rates. Retail energy’s variable rates can change each invoice and have no maximums.
From the report: “Suppliers appear to be aware that consumers are partially inattentive to price, and they seem to price discriminate on this inattention through gradual price increases over a customer’s tenure.”[14]
[14] Page 16
# 9 The Net: Low-income households Pay Highest Electricity Prices
From report, “Low-income households pay substantially higher prices than high-income households primarily due to lower marketing costs in low-income communities. Auxiliary analyses rule out alternative explanations, such as differing underpayment risks or preferences for differentiated product attributes.” [15]
“Many low-income households keep their homes at unsafe temperatures and sacrifice food or medical care due to high energy costs (NEADA 2018).” [16]
[15] Page 1 [16] Page 1 [17] Page 1
Median Prices Over Time by Income Group[17]

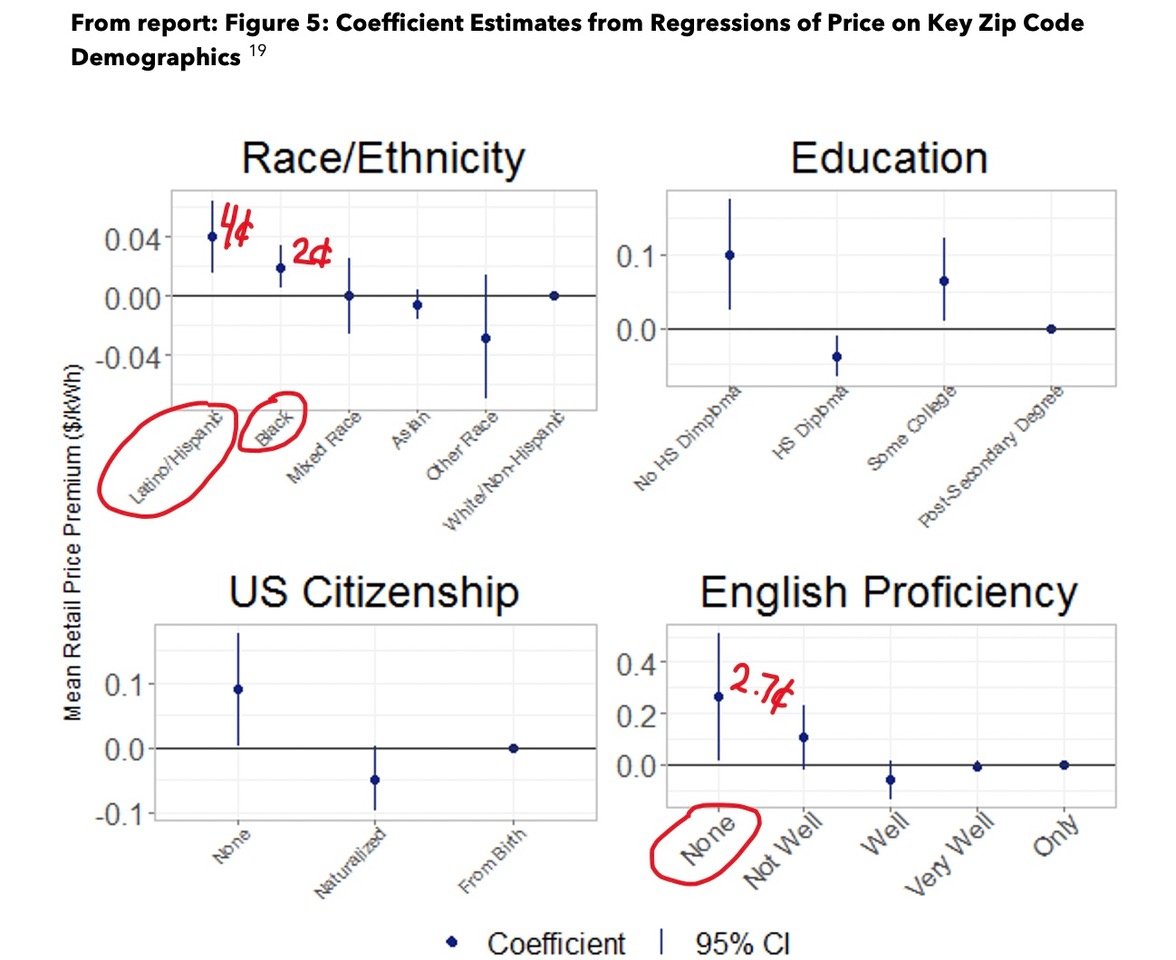
#10 All factors combined Resulted in Price Discrimination with Hispanic, black, and immigrant families paying highest electricity rates
From report, “The percentage of Black residents is a particularly strong metric for predicting variation in mean price across zip codes. This variable can explain 45% of the variation in mean September 2019 prices across zip codes.” [18]
[18] Page 12